Table of Contents [expand]
Last updated January 12, 2026
Expensive queries are database queries that run slowly and/or spend a significant amount of their execution time reading and writing to disk. Such queries are the most common cause of performance issues on Heroku Postgres databases.
Optimizing expensive queries can significantly improve your application’s performance and overall response times.
Heroku Enterprise customers with Premier or Signature Success Plans can request in-depth guidance on this topic from the Customer Solutions Architecture (CSA) team. Learn more about Expert Coaching Sessions here or contact your Salesforce account executive.
Viewing Expensive Queries
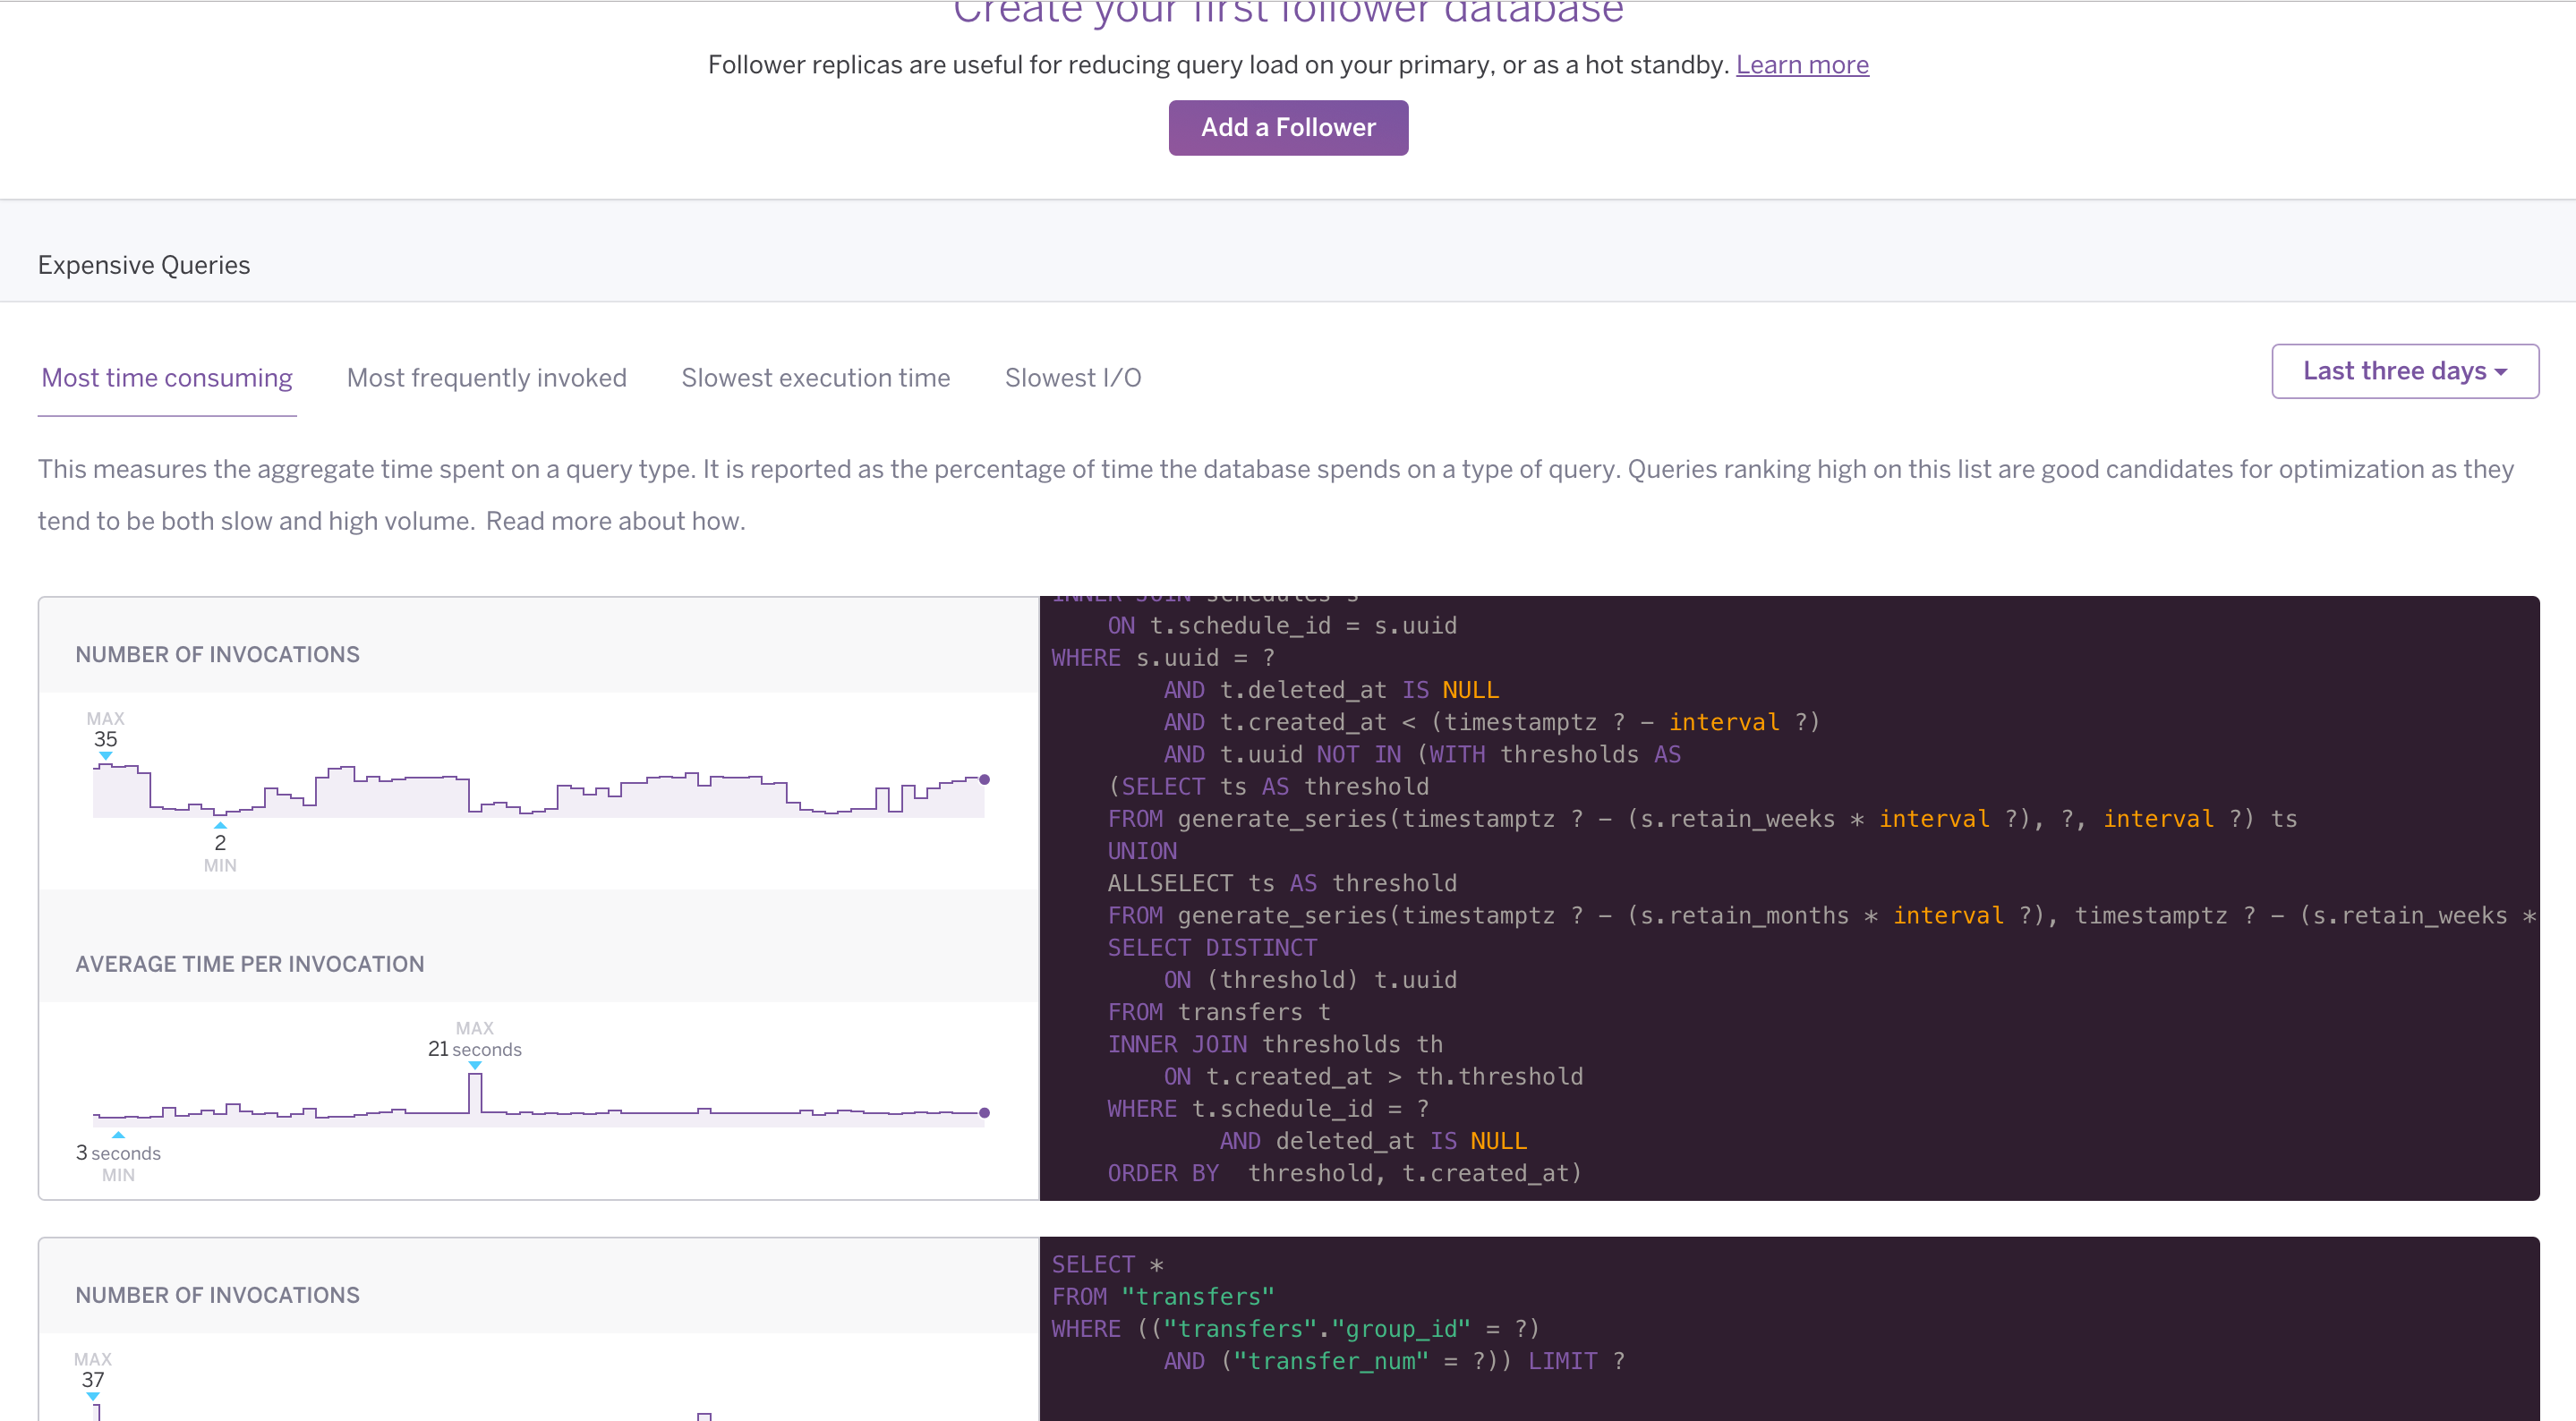
You can view expensive queries for your database from the Heroku Dashboard. Select a database from the list and navigate to its Diagnose tab.
The Diagnose tab isn’t available for Essential or Shield-tier databases.

Queries for each category (most time consuming, most frequently invoked, etc.) are shown, with the most likely candidates for optimization at the top. Each query has accompanying graphs that show how often the query executes and how much time it usually takes. Expensive query data is available for up to the last seven days.
Identifying Slow Parameter Values
If a slow query uses bind parameters ($1) or query parameters (?), the Diagnose tab does not show the values of those parameters. Performance can vary significantly between different parameter values for a given query.
To help you identify particularly slow parameter values, Heroku outputs the slowest queries (that take 2 seconds or more) and their parameters to your application’s logs if you enable slow query logs. You can use a logging add-on to search your log data for these slow queries.
For example:
2025-12-10T11:40:02 app[postgres.3113882]:  [DATABASE] [41-1] LOG:  duration: 2406.615 ms  execute <unnamed>: SELECT  "issues".* FROM "issues" WHERE "issues"."repo_id" = $1 AND "issues"."state" = $2 ORDER BY created_at DESC LIMIT $3 OFFSET $4
2025-12-10T11:40:02 app[postgres.3113882]:  [DATABASE] [41-2] DETAIL:  parameters: $1 = '1348', $2 = 'open', $3 = '20', $4 = '760'
This query took 2.4 seconds to execute. Its parameter values were 1348 for repo_id, open for state, 20 for the query’s LIMIT, and 760 for the query’s OFFSET. You can use this information with EXPLAIN ANALYZE to profile why a particular parameter combination is slow.
Causes of Expensive Queries
The most common causes of expensive queries are:
- A lack of relevant indexes, causing slow lookups on large tables
- Unused indexes, causing slow
INSERT,UPDATE, andDELETEoperations - An inefficient schema leading to bad queries
- Inefficiently designed queries
- High lock contention
- Large database size causing slow
COPYoperations (used for logical backups)
Solutions to Expensive Queries
Here are some guidelines that help fix expensive queries:
- Run
EXPLAIN ANALYZE(via pg:psql) to find out what’s taking most of the query’s execution time.- For example, a sequential scan on a large table is often a bad sign. Efficient indexes can improve query performance dramatically. Consider all Postgres techniques, such as partial indexes, when devising your index strategy.
- Use further
EXPLAINoptions, such asBUFFERSandVERBOSEto show additional information about the query plan and its execution. For example:EXPLAIN (ANALYZE, BUFFERS, VERBOSE).
- Identify unused indexes by running
heroku pg:diagnose. Drop any indexes that aren’t required. - Upgrade your database to the latest version. Postgres performance improves with virtually every release.
- For large databases, prefer relying on Heroku’s continuous protection for day-to-day disaster recovery purposes. Remove any auto
pg:backupsplans, and usepg:backupsstrictly for extracting or migrating data. - For smaller databases, slow logical backups can be a result of lock contention.
- Use
pg:outliersfrom Heroku pg-extras to find queries that have a high proportion of execution time.
Resetting Statistics
You can reset the internal Postgres statistics to make it easier to see the effects of changes.